


EB-5 Visa Statistics by Country for FY2022 show the latest number of EB-5 Visa issuances per country and region. EB-5 Visa Statistics are issued by the U.S. Department of State (DOS) through the annual Report of the Visa Office. Asia is the leading region for EB5 Visa issuances with China, India, Vietnam, South Korea, and Taiwan listed among the top 5 EB5 countries. Mexico, Canada, Russia, and Iran moved up in rank for FY2022 from their numbers in FY2019.
EB 5 Statistics for FY 2022 reflect higher numbers of permanent residency achieved through adjustment of status compared to data from FY2019. The rise in the adjustment of status approvals is due to the efforts of the U.S. Citizenship and Immigration Services (USCIS) to make up for the delays caused by the COVID-19 pandemic. 2022 EB-5 Statistics for Consular Processing on the other hand are lower compared to numbers from FY2019 due to the limited capacity of consular offices and restrictions of the pandemic.
What are the Top Countries for EB-5 Visa for FY2022?
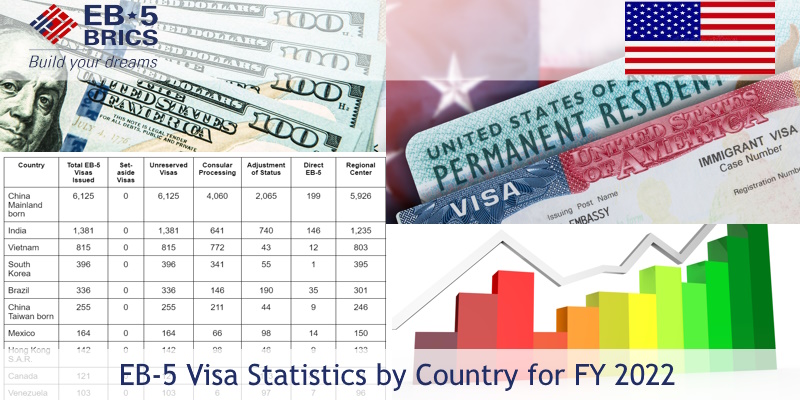
China and India continue to be the top sources of EB 5 investors for FY2022 followed by Vietnam, South Korea, Brazil, and Taiwan. Mexico, Canada, Russia, and Iran moved up in ranking while Venezuela, South Africa, Great Britain, and Japan moved a few ranks down compared to their numbers from FY2019.
The table below summarizes the EB-5 statistics by country for FY2022 based on the most recent Report of the Visa Office.
| Country | Total EB-5 Visas Issued | Set-aside Visas | Unreserved Visas | Consular Processing | Adjustment of Status | Direct EB-5 | Regional Center |
|---|---|---|---|---|---|---|---|
| China Mainland born | 6, 125 | 0 | 6, 125 | 4, 060 | 2, 065 | 199 | 5, 926 |
| India | 1, 381 | 0 | 1, 381 | 641 | 740 | 146 | 1, 235 |
| Vietnam | 815 | 0 | 815 | 772 | 43 | 12 | 803 |
| South Korea | 396 | 0 | 396 | 341 | 55 | 1 | 395 |
| Brazil | 336 | 0 | 336 | 146 | 190 | 35 | 301 |
| China Taiwan born | 255 | 0 | 255 | 211 | 44 | 9 | 246 |
| Mexico | 164 | 0 | 164 | 66 | 98 | 14 | 150 |
| Hong Kong S.A.R. | 142 | 0 | 142 | 96 | 46 | 9 | 133 |
| Canada | 121 | 0 | 121 | 8 | 113 | 47 | 74 |
| Venezuela | 103 | 0 | 103 | 6 | 97 | 7 | 96 |
| Russia | 97 | 0 | 97 | 51 | 46 | 6 | 91 |
| Iran | 95 | 0 | 95 | 85 | 10 | 5 | 90 |
| South Africa | 95 | 0 | 95 | 46 | 49 | 9 | 86 |
| Great Britain | 74 | 0 | 74 | 35 | 39 | 14 | 16 |
| Argentina | 50 | 0 | 50 | 22 | 28 | 7 | 43 |
| Turkey | 49 | 0 | 49 | 24 | 25 | 5 | 44 |
| Nigeria | 45 | 0 | 45 | 38 | 7 | 0 | 45 |
| Singapore | 33 | 0 | 33 | 19 | 14 | 0 | 33 |
| Egypt | 25 | 0 | 25 | 12 | 13 | 0 | 19 |
| Pakistan | 24 | 0 | 24 | 19 | 5 | 2 | 22 |
| Ecuador | 24 | 0 | 24 | 9 | 15 | 3 | 21 |
| Colombia | 22 | 0 | 22 | 4 | 18 | 1 | 21 |
| Japan | 20 | 0 | 20 | 14 | 6 | 5 | 15 |
| France | 20 | 0 | 20 | 8 | 12 | 7 | 13 |
| All other countries | 374 | 0 | 374 | 149 | 225 | 78 | 346 |
| Total EB-5 Visas Issued | 10, 855 | 0 | 10, 855 | 6, 882 | 4, 003 | 621 | 10, 264 |
EB 5 Statistics by country also show the top regions with the most EB5 Visa issuances for FY2022. Asia is the leading region for EB-5 Visa issuances followed by South America and Europe based on the 2022 Report of the Visa Office data summarized in the table below.
| Country | Total EB-5 Visas Issued | Set-aside Visas | Unreserved Visas | Total % Worldwide | Consular Processing | Adjustment of Status |
|---|---|---|---|---|---|---|
| Africa | 193 | 0 | 193 | 1.18% | 109 | 84 |
| Asia | 9, 411 | 0 | 9, 411 | 86.5% | 6, 323 | 3, 088 |
| Europe | 404 | 0 | 404 | 3.7% | 178 | 226 |
| North America | 315 | 0 | 315 | 2.9% | 79 | 236 |
| Oceania | 7 | 0 | 7 | 0.1% | 1 | 6 |
| South America | 555 | 0 | 555 | 5.1% | 192 | 363 |
| Total EB-5 Visas Issued | 10, 855 | 0 | 10, 855 | 100.0% | 6, 882 | 4, 003 |
Read more on EB 5 Visas by Country.
What are EB-5 Visa Statistics?
EB-5 Visa Statistics are data issued by the U.S. Department of State (DOS) reflected in the agency’s Report of the Visa Office. EB-5 Visa Statistics are released annually through the agency’s website specifically under Table V, Part 3 and Table VI, Part 4 under Employment 5th category. These numbers show how many EB5 Visa applicants gained permanent residence in the USA for the past fiscal year. EB-5 Statistics do not reflect the current demand for the 5th Employment category as the lengthy Form I-526 (Immigrant Petition by Standalone Investor) processing times significantly delay the application for EB5 Conditional Permanent Residency, especially for investors from China and India.
How Many EB-5 Visas are Available Each Year?
The U.S. Citizenship and Immigration Services (USCIS) allots 10,000 EB 5 Visas each year constituting 7.1% of the total allocation for the Employment-Based Immigrant Visa categories. Each country cannot have more than 7% of the total EB 5 Visas available each year regardless of the country’s population or demand for EB-5 Visas. The quota for EB-5 and the limit per country causes significant backlogs for countries with high-volume of EB5 applications such as China and India. The U.S. Citizenship and Immigration Services (USCIS) does issue excess EB5 Visas at the end of each fiscal year to investors from countries that have exceeded their annual limit.
How has the EB-5 Reform and Integrity Act Affected EB-5 Visa Statistics for FY2022?
The EB-5 Reform and Integrity Act (RIA) created changes to the EB-5 Program including the allotment of visa set-asides for investors in Targeted Employment Areas (TEAs). Targeted Employment Areas (TEAs) are either rural areas or high unemployment regions. A total of 32% of visa set-asides are reserved for TEA investors together with the availability of priority processing of their I-526 petitions. The Report of the Visa Office for FY 2022 now includes columns differentiating “5th Set-Aside” and 5th Unreserved” categories. The Reform and Integrity Act (RIA) was only instituted on March 15, 2022 so no reserved visas were issued for FY2022 as EB5 petitions filed after March 15, 2022 will have been adjudicated by the end of the fiscal year. EB-5 statistics by country for reserved visas are expected by FY2024 and FY2025 considering current regulations and processing times.
How Many EB-5 Visas Were Issued Through Consular Processing in FY2022?
There were 6,882 EB5 Visas issued through consular processing for FY2022. The latest EB 5 Statistics for consular processing are lower than the numbers from FY2019 (7,899 EB5 Visas issued) due to backlogs brought on by the COVID-19 pandemic.
How Many EB-5 Visas Were Issued Through Adjustment of Status in FY2022?
There were 4,003 EB 5 Visas issued through adjustment of status (AOS) in the USA for FY2022. The number of EB5 investors who were able to gain permanent residence through adjustment of status (AOS) was significantly higher for FY2022 than in FY2019 (1,589 EB-5 Visas issued). The 2022 EB-5 Statistics for AOS reflect the efforts of USCIS to make up for the delays in processing for EB5 applicants in the United States amidst the difficulties of visa processing in US Embassies and Consulates.
What to Expect for Future EB-5 Visa Statistics?
The future EB5 Statistics depend on the associated wait times for I526 petitions, the number of EB5 Visas to be issued annually, and the number of investors who will likely drop out or lose eligibility before obtaining a visa. Indian and Chinese investors who submitted Form I526 between November 2019 and March 2022 are projected to wait 5 or more years simply to receive Conditional Permanent Residence. Dropouts are inevitably caused by the demands on EB-5 regional centers and project developers owing to the lengthy processing times. New EB-5 investors in reserved categories must think about the limited availability of these visas per subclassification and make educated guesses about when I 526 filings will covertly accumulate and exhaust that limited availability. Of the visa set-asides for EB 5, 20% are alloted to rural TEA investors, 10% to high-unemployment investors, and 2% to infrastructure investors. The EB 5 visa allocation is further constrained under the 7% country ceiling.
Check the EB-5 Visa Statistics for I-526 and I-829 for FY 2023 Q1.
How Does EB-5 Processing Time Affect EB5 Visa Statistics for 2022?
A presentation on EB-5 processing time and visa backlog by Invest in the USA (IIUSA) in April 2022 is a reminder of the size of the EB5 Visa line prior to the issuing of FY2022 visas. At that time, it was estimated that there were 57,253 visa applications for China, 7,418 for India, 3,954 for Vietnam, and 18,054 for other countries in the EB-5 backlog (including applicants already registered at the National Visa Center and prospective future applicants linked with I-526 pending at USCIS). The EB5 Visas issued in FY2022 shortened the wait times by 6,125 visas for China, 1,381 visas for India, and 815 visas for Vietnam.
The EB5 Visa priority date is the day USCIS receives the I-526 from the EB 5 investor. The investor’s place in line for an EB5 Immigrant Visa is determined by the priority date. The final action dates for EB5 Visas are listed in the monthly Visa Bulletin on the website of the US Department of State (DOS). The priority date is regarded as “current” if the EB-5 investor’s I-526 priority date and Visa Bulletin final action date are the same and indicates a readily available EB-5 Visa. All countries have current priority dates except for China and India. See more for Priority Date for EB5.